essay代写案例-Current Condition and Prospects of Data Analyst Role in Canada

1. Introduction
In 2018, Canada’s youth employment rate averages at 11%, which is the lowest since 1989 (Janzen, 2018). One of the increasingly popular professions nowadays is data analysis. In this paper I evaluate the current situation and future prospects of being a data analyst in Canada. Job Bank data by the Government of Canada is utilized under search criteria Data Analyst – Informatics and Systems. LinkedIn Salary is also considered to fill in gaps.
2. Analysis
1) Findings
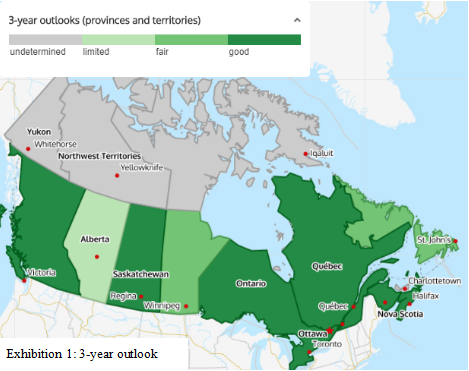
According to Job Bank, the overall outlook of data analyst looks promising as 6 out of the 9 provinces that reported data show “good”. Two provinces show “fair” and Alberta is the only province showing “limited” (Exhibition 1). This indicates in the next 3 years, there is good foreseeing growth and demand in the occupation in most heavy-populated areas.
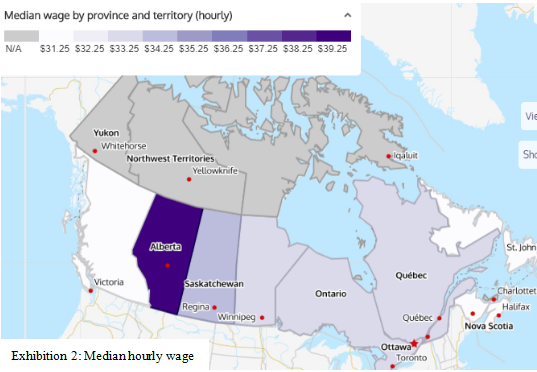
Looking at the wages (Exhibition 2), most provinces have median hourly wage in the $31.25-$35.25 range. The exception is Alberta, toping at $42.38. The overall national median wage is $34.87, which is actually on the higher side of the common range. This is most likely caused by the difference in data size from different provinces. The regions with higher median can have a larger impact on the national median by having more data.
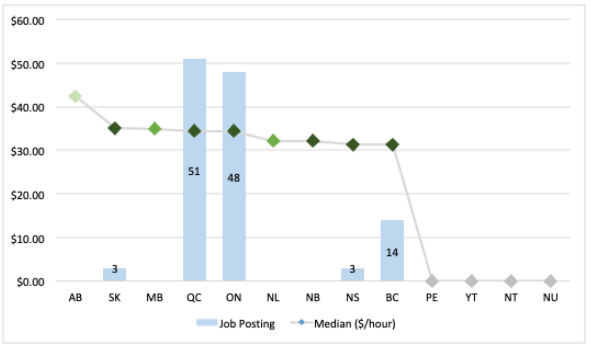
To better observe the situation in difference regions, I created a chart combining three variables: number of job postings, median wage, and 3-year outlook (Exhibition 3: the darker color of data marker, the better 3-year outlook). There are only 119 job postings of data analyst in Canada, with Quebec and Ontario together taking 99 (83%). This indicates available job opportunities are very imbalanced among different regions. Saskatchewan, New Brunswick, and Nova Scotia, despite the good outlook, have very limited or none job openings. Thus, the outlook is probably not a strong enough indicator of prospects of the profession in an area. On the other hand, Alberta has the highest median wage but no data for job posting and also “limited” outlook. This could mean that the demand and growth is limited in the region despite the high salary, which could be caused by the data sample being mainly senior-level roles with high pay.
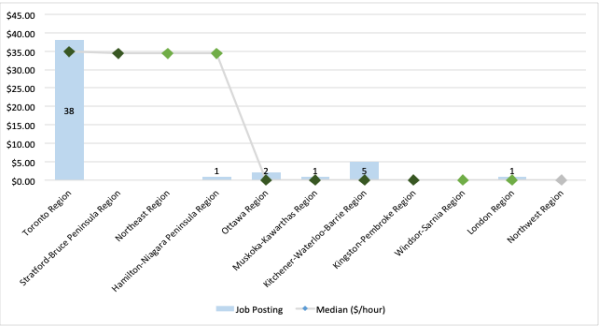
To further investigate within one province, I take Ontario for a deeper dive. I also generated a multi-variable chart for different regions within Ontario (Exhibition 4: the darker of data marker, the better outlook). Similarly, good outlook and high wage does not guarantee opportunities. In fact, 38 out of the 48 job postings in the province are located in Toronto Region. The rest of job openings are also relatively close to Toronto metropolitan area. This leads me to believe job opportunities are closely tied to population, city size and city’s economic situation. Though there seems to be good outlook in some faraway areas such as Stratford or Kingston, big cities are still the major source of jobs.
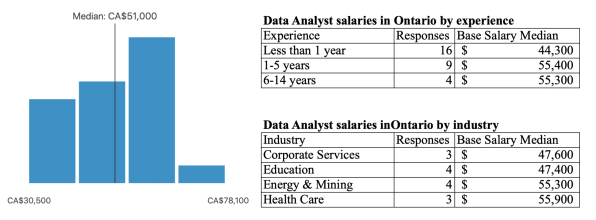
LinkedIn Salary data is also included. There are 21 salaries reported in Ontario for data analyst roles (Exhibition 5). Base salary median is at $51,000 per year with actual range of $31,000 to $78,000. There is category for experience and industry (Exhibition 5). It looks like the junior level of a data analyst role get paid significant less than a senior role in Ontario. It also shows that the salary can vary significantly between industries. It looks like in Ontario it is important for a data analyst to have more experience and be in the correct industry.
2) Limitations
One of the obvious and major limitations of this analysis is the small size of data. Job Bank does not specify how many data points are analyzed for each province. A small sample size can lead to bias of measurements. For example, while defining the 3-year outlook, net needs is calculated by (employment growth + attrition – available experience unemployed workers) / projected average employment. With the vast difference of population and workforce dynamics in separate provinces, one province with very small population and job demand can end up having the same good result as one with much larger ones. For example, region A has only 100 data analyst roles, but 50 are senior level roles. Region B has 1,000 roles but only 100 are senior level. The calculation can show A has higher salary than B, appearing to be a more appealing area, though B is in fact a much larger market for the profession with potentially more job openings. There is no standardization in the formula to eliminate this impact. Alberta is another example illustrated in Job Bank’s data.
The data size issue also exists in LinkedIn data. The sample size is too small to drive valid insight based on experience and industry.
3) Possible improvement
Based on limitation mentioned above, it would be very helpful to get more data on job openings, years of experience, and industry. A larger sample size will create a more comprehensive view and eliminate individual impact on the overall outcome.
More insights are also be gained by having data on tenure of the role. Knowing how long people usually stay in a data analyst role will indicate how stable and consistent the profession is. Gaining data on gender of the workforce would tell us if the profession is more welcoming to male or females, or hopefully, both. Another possible perspective to get is the educational background of the workforce, for instance the level and area of degrees owned. This will tell us how whether the profession has flexibility in skillset, and whether is friendly to diverse school majors.
3. Conclusion
The findings have shown that the role of Data Analyst – Informatics and Systems have overall good outlook, but the situation can be vastly different depending on region. Job opportunity is not necessarily consistent with the outlook in some areas. Therefore, one should consider comprehensively on multiple aspects. The prospect is positive, but picking the right region can cast big impact on the specific data analyst role one has.
References:
Government of Canada (n.d.). Explore an occupation. Job Bank. Retrieved from: https://www.jobbank.gc.ca/trend-analysis/search-occupations
Government of Canada (n.d.). Visualize labor market information. Job Bank. Retrieved from: https://clmi-explore-icmt.ca/viz?page=home&lang=en
Janzen, N. (2018). What’s the problem with Canada’s youth labor markets? RBC Economics. Retrieved from: http://www.rbc.com/economics/economic-reports/pdf/other-reports/Canadianyouthlabour_Jul2018.pdf
LinkedIn Salary. Retrieved from: https://www.linkedin.com/salary/.
关键词:essay代写;网课代修


